TidalSim: Multi-Level Microarchitecture Simulation and Applications in Verification
Vighnesh Iyer, Raghav Gupta, Dhruv Vaish, Bora Nikolic, Sophia Shao
ATHLETE Quarterly Review
Monday, December 4th, 2023
Motivation and Background
Motivation
- We want fast design iteration and evaluation of PPA + verification given real workloads
- Performance estimation: Impact of μArch optimizations / HW parameters on real workloads
- Power macromodeling: Identification of important netlist nodes in power model + traces for training
- Verification: Bootstrapping fuzzing loops + coverpoint synthesis
- The enablers are: fast and accurate μArch simulation and a way to identify unique execution fragments
- Performance estimation: Performance metric extraction from fast RTL simulation
- Power macromodeling: Extraction of interesting program traces for clustering/training
- Verification: Extraction of traces for coverpoint/specification synthesis + state seeding for fuzzing
Problem Overview
Fast RTL-level μArch simulation and performance metric / interesting trace extraction
enables
Rapid RTL iteration with performance, power modeling, and verification evaluation on real workloads
How can we achieve high throughput, high fidelity, low latency μArch simulation with RTL-level interesting trace extraction?
Existing μArch Evaluation Strategies
| Throughput | Latency | Fidelity | |
|---|---|---|---|
| ISA Simulation | 10-100+ MIPS | <1 second | None |
| μArch Perf Sim | 100 KIPS (gem5) | 5-10 seconds | 5-10% avg IPC error |
| RTL Simulation | 1-10 KIPS | 5-10 minutes | cycle-exact |
| FireSim (FPGA) | 1-50 MIPS | 2-6 hours | cycle-exact |
| TidalSim | 10 MIPS | <1 minute | <5% error, 10k intervals |
- Combine the strengths of ISA, μArch, and RTL simulators
- Multi-level simulation
Phase Behavior of Programs
- Program execution traces aren’t random
- They execute the same code again-and-again
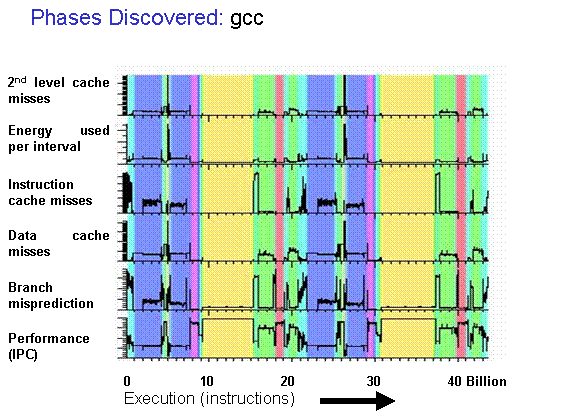
- Application execution traces can be split into phases that exhibit similar μArch behavior
- Prior work: SimPoint
- Identify basic blocks executed in a given interval (e.g. 1M instruction intervals)
- Embed each interval using their ‘basic block vector’
- Cluster intervals using k-means
- Similar intervals → similar μArch behaviors
- Only execute unique intervals in low-level RTL simulation!


Prior Work
- Sampled simulation techniques have been used in μArch simulators for decades
- SimPoint-style sampling (interval clustering, large intervals)
- SMARTs-style sampling (reservoir sampling, small intervals)
- Implemented in gem5, Sniper, ZSim, SST
- LiveSim proposed 2-level simulation (ISA → μArch sim) for rapid iteration of μArch parameters
- Functional warmup was used for the cache and branch predictor models
What's New
- No prior work on ISA ↔ μArch models ↔ RTL multi-level simulation with functional warmup
- No substantial work on binary-agnostic interval embeddings
- No one has leveraged the special collateral (waveforms + high-fidelity performance metrics) you can only get from RTL simulation
Overview of Multi-Level Simulation Flow
Details of TidalSim Flow
Basic Block Identification
Basic blocks are extracted from the dynamic commit log emitted by spike
core   0: >>>>  memchr
core   0: 0x00000000800012f6 (0x0ff5f593) andi    a1, a1, 255
core   0: 0x00000000800012fa (0x0000962a) c.add   a2, a0
core   0: 0x00000000800012fc (0x00c51463) bne     a0, a2, pc + 8
core   0: 0x0000000080001304 (0x00054783) lbu     a5, 0(a0)
core   0: 0x0000000080001308 (0xfeb78de3) beq     a5, a1, pc - 6
- Control flow instructions mark the end of a basic block
- Previously identified basic blocks can be split if a new entry point is found
0: 0x8000_12f6 ⮕ 0x8000_12fc1: 0x8000_1304 ⮕ 0x8000_1308
Program Intervals
A execution trace is captured from ISA-level simulation
core   0: >>>>  memchr
core   0: 0x00000000800012f6 (0x0ff5f593) andi    a1, a1, 255
core   0: 0x00000000800012fa (0x0000962a) c.add   a2, a0
core   0: 0x00000000800012fc (0x00c51463) bne     a0, a2, pc + 8
core   0: 0x0000000080001304 (0x00054783) lbu     a5, 0(a0)
core   0: 0x0000000080001308 (0xfeb78de3) beq     a5, a1, pc - 6
core   0: 0x000000008000130c (0x00000505) c.addi  a0, 1
core   0: 0x000000008000130e (0x0000b7fd) c.j     pc - 18
core   0: 0x00000000800012fc (0x00c51463) bne     a0, a2, pc + 8
The trace is grouped into intervals of N instructions
Typical N for SimPoint samples is 1M
Typical N for SMARTs samples is 10-100k
Interval Embedding and Clustering
Embed each interval with the frequency it traversed every identified basic block
| Interval index | Interval length | Embedding |
|---|---|---|
| n | 100 | [40, 50, 0, 10] |
| n+1 | 100 | [0, 50, 10, 40] |
| n+2 | 100 | [0, 20, 20, 80] |
Intervals are clustered using k-means clustering on their embeddings
Arch Snapshotting
For each cluster, take the sample that is closest to its centroid
Capture arch checkpoints at the start each chosen sample
pc = 0x0000000080000332
priv = M
fcsr = 0x0000000000000000
mtvec = 0x8000000a00006000
...
x1 = 0x000000008000024a
x2 = 0x0000000080028fa0
...
An arch checkpoints = arch state + raw memory contents
RTL Simulation and Arch-State Injection
- Arch checkpoints are run in parallel in RTL simulation for N instructions
- RTL state injection caveats
- Not all arch state maps 1:1 with an RTL-level register
- e.g.
fflagsinfcsrare FP exception bits from FPU μArch state - e.g.
FPRsin Rocket are stored in recoded 65-bit format (not IEEE floats)
- Performance metrics extracted from RTL simulation
cycles,instret
1219,100
125,100
126,100
123,100
114,100
250,100
113,100
Extrapolation
Performance metrics for one sample in a cluster are representative of all samples in that cluster
Extrapolate on the entire execution trace to get a full IPC trace
Early Results
Clustering on Embench Benchmarks
- Cluster centroids indicate which basic blocks are traversed most frequently in each cluster
- We observe that most clusters capture unique traversal patterns
IPC Trace Prediction
- Montgomery multiplication from Embench (aha-mont64)
N=1000,C=12- Full RTL sim takes 10 minutes, TidalSim runs in 10 seconds
- IPC is correlated (mean error <5%) and mild correlation between distance and error
Work in Progress
Functional Cache Warmup
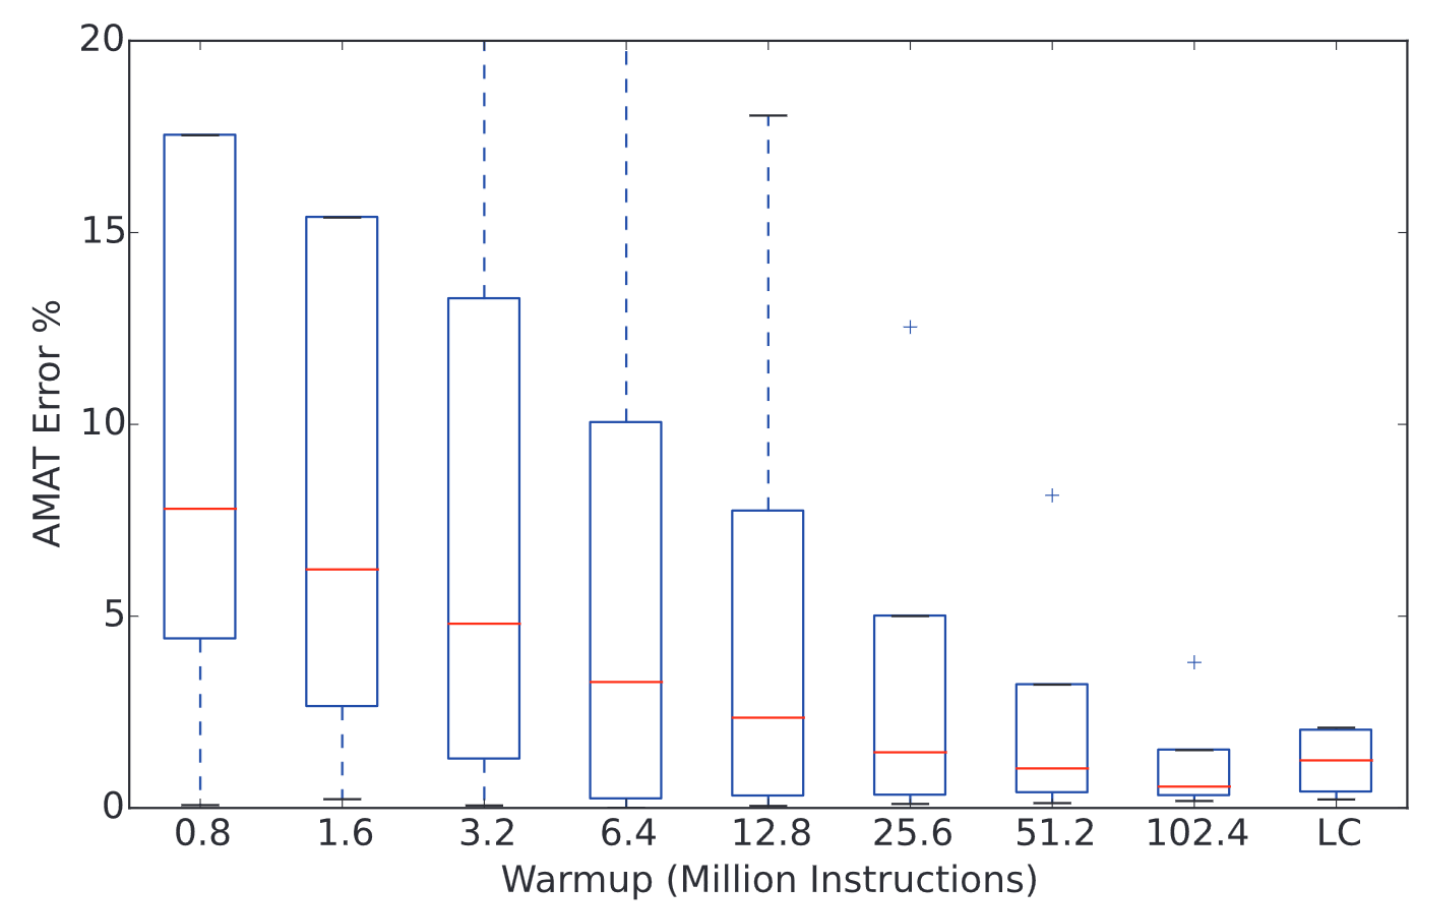
- Each checkpoint is run in RTL simulation with a cold cache → inaccurate IPC due to incomplete cache warming during detailed warmup
- WIP: "Memory Timestamp Record"[2] based cache model and RTL cache state injection

[1]: Hassani, Sina, et al. "LiveSim: Going live with microarchitecture simulation." HPCA 2016.
[2]: Barr, Kenneth C., et al. "Accelerating multiprocessor simulation with a memory timestamp record." ISPASS 2005.
Performance Optimizations
- Currently two runs of the binary through spike are needed
- One to get a commit log for basic block extraction, embedding, and clustering
- One more to dump arch checkpoints for chosen samples
- We can take regular checkpoints during the first execution to make arch checkpoint collection fast
Validation of State Injection
- There is no arch state comparison at the end of a checkpoint run in RTL simulation
- We will standardize a arch state schema and dump a reference state from spike to check against
Handling Large Interval Lengths
- Real programs will use large intervals (1-10M instructions)
- Selected intervals can't be run in their entirety in RTL simulation
- Sub-sampling intervals with random sampling is required
Applications
Performance and Power Evaluation
- Fast, low-latency evaluation of HW parameters on long running workloads
- Cache sizing between L1d vs L1i
- Balancing of 2-level cache hierarchies
- Unified vs separate i/d L2 caches
- Trace extraction for power model construction
- Currently power macromodels are built + trained only on workloads that can run in RTL simulation
- TidalSim enables extraction of unique, short traces from full workloads
- Potential to improve signal selection and uncover holes in training datasets
Issues with HW Fuzzer Evaluations
- Last time: discussed deficiencies in existing HW fuzzing evaluations due to bad success/feedback metrics
- Structural coverage is too easy to hit
- Time to rediscover old bugs is too biased and forces us to use old RTL
- Bad metrics ⮕ dubious conclusions
- We should save >50% of mutated stimuli (vs <1% for SW fuzzers)
- RTL-level feedback is useless for hitting bugs or improving coverage (vs SW fuzzers making no progress without feedback)
Can we synthesize metrics that lead to reasonable HW fuzzer evaluations?
Coverpoint Synthesis
- Specification mining takes waveforms of an RTL design and synthesizes properties involving 2+ signals that are unfalsified on all traces
- Coverpoint synthesis is an alternative take on spec mining where we synthesize μArch properties that we want to see more of
- This technique is far more effective if we have many unique, realistic traces
- Leverage interval clustering and sampled RTL simulation
Bootstrapping Fuzzing
- Most HW fuzzers start from reset and run a binary on the SoC to hit some objective
- Interesting objectives are harder to hit from reset vs from the middle of a workload
- e.g. post-OS boot, in the middle of an application
- Arch and μArch checkpoints from TidalSim guarantee reachability and provides starting points for HW fuzzers
Conclusion
- We want rapid iteration wrt PPA evaluation and verification objectives
- We need fast RTL-level simulation with trace extraction
- We propose TidalSim, a multi-level simulation methodology to enable rapid HW iteration