An API and Methodology for Microarchitectural Event Tracing
Vighnesh Iyer
Group Meeting
Friday, Feburary 16th, 2024
Motivation and Background
Motivation for Event Tracing
- Main Questions
- What is our RTL design doing when running this workload?
- Why is it doing that?
- How is it doing that?
- Commit logs are too coarse-grained (instruction level)
Instructionretires atcycleand writes aregisterwith somevalue- It also accesses this
memory addressand performs thismemory operation - We can't answer why or how an instruction behaves as it did
- Waveforms are too fine-grained
- Here is the value of every single bit in your RTL design for millions of cycles
- How are we supposed to make sense of this?
- Transaction-level waveforms may ease the human burden a bit
- Dependency chains aren't captured
uArch Event Graphs
- Events are defined in RTL (and in a performance model)
- An event has
- Scope: which RTL instance and node it is attached to
- Trigger: the RTL condition that causes this event to fire
- Metadata: data that's attached to this event
- Tag: a unique identifier for this particular event
- Parents: predecessor events that caused this event to happen
- Children: successor events that are caused by this event
- Interesting microarchitectural events are manually annotated
Event graphs are a useful middle-ground between commit logs and waveforms (and can augment both of them).
What Can uArch Event Graphs Enable?
- Performance metric extraction
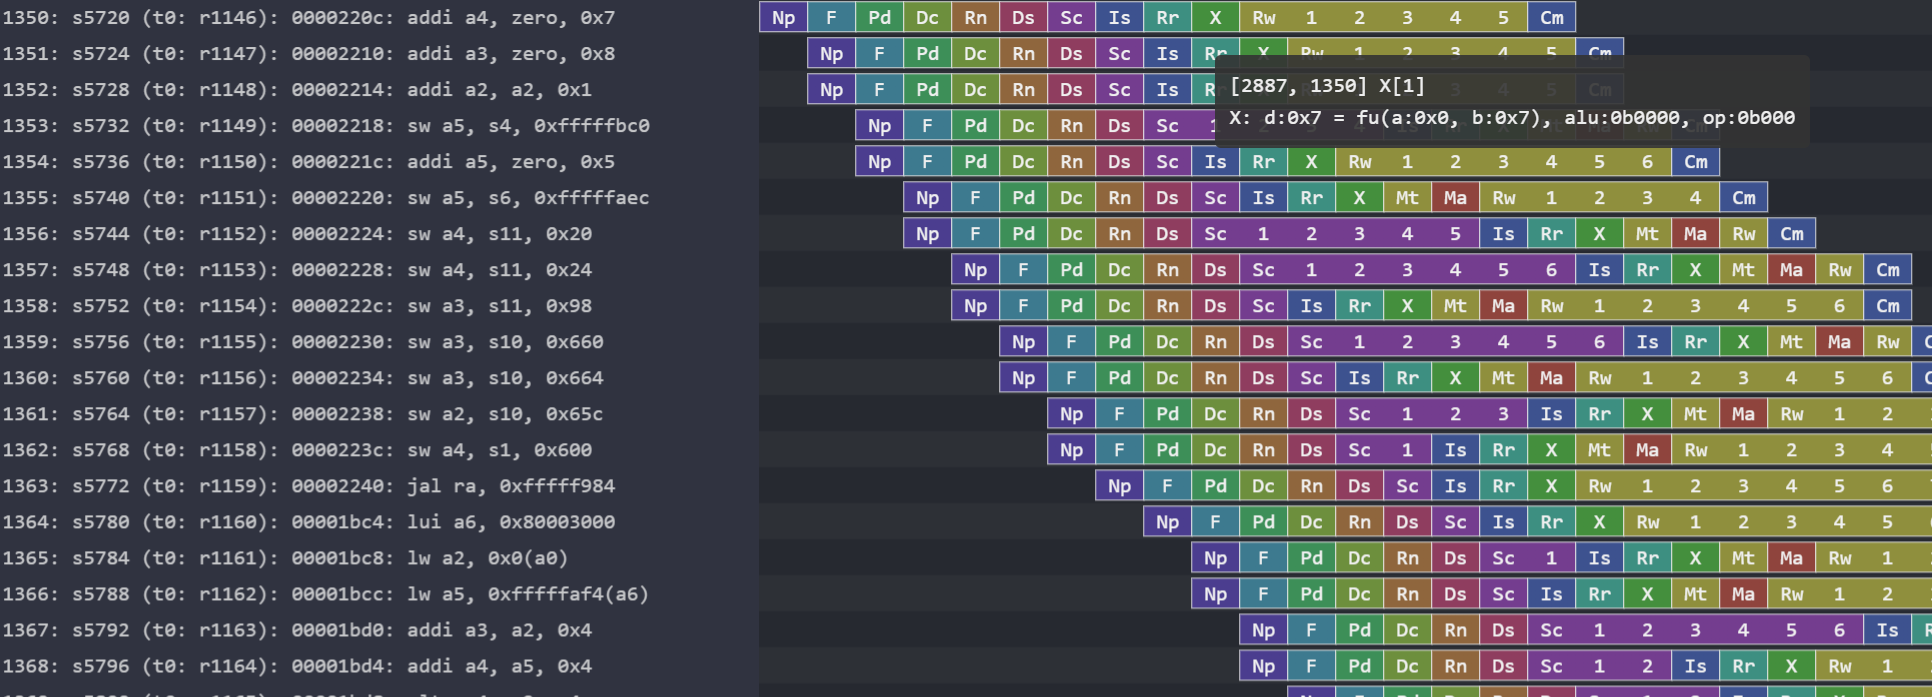
- Pipeline visualization
- Subgraph clustering to identify unique event traces
- Anomaly detection / intelligent graph diff for RTL optimizations
- Post-silicon debug/validation / model correlation

Aside: Event Tracking APIs at Apple
- What do the event APIs look like? (RTL and performance model)
- What metadata is associated with an event?
- How are events tracked? How are parents identified? Is event tag propagation done manually?
- What events are visible in post-silicon debug? How are events used post-silicon?
- How are event graphs used for RTL debug? How are they summarized for human consumption?
- Are there existing unsupervised learning techniques used to find anomalies or extract unique fragments?
- How are event graphs visualized? Is there a common viewer tool for profiling and event traces?
Feedback From Apple
- They use the event API primarily for pre-silicon debugging
- They use a pure software tag manager
- Manual tag propagation
- Post-silicon visible events use a different API
- Performance bugs are caught at block or subsystem level (NOT SoC-level)
- SoC-level event traces only contain system-level events (NOT pipeline events)
- There is magic for extracting event traces from silicon
- Trace buffer is in DRAM, can sample events in time and space, avoid perturbing the uArch from trace dumping
- Hardware for on-the-fly trace encoding and compression
- Only extract events that are relevant for future generations
An Implementation Sketch
A Simple API for Orphan Events
time: 1, event: "e", metadata: { d: d1 }
time: 5, event: "e", metadata: { d: d2 }
time: 8, event: "e", metadata: { d: d3 }
- This isn't a graph though, it is just a log
- We need to track parent/child relationships between 2 or more events
Extending the API with Event Tags
- A tag uniquely identifies an event instance
- Tags are referenced in other events to establish a parent/child relationship
- Absolute tags don't support multiple event instances triggred in the same cycle
- Tag bits are overprovisioned
Improving Event Tags
- How many tags can be in flight simultaneously?
- When should a tag be recycled?
Multiple Tags in Flight
- Use a CAM to store the tag associated with each ROB entry; dequeue and reference the tag when an element is pulled from the ROB
- How many tags can be in flight at the same time?
- Manual tag management is becoming tedious
Leveraging Hardware Compilers for Event Tracing
Trackers
- Trace every parent to a tracker that can lead there (in general: information flow tracking)
- Identify every case where a tracker 'moves' from one location to another and synthesize a tracking tag map
- Recycle tags when no more parents exist that can consume it
Information Flow Tracking
- Although the idea might seem simple, the implementation is complex (multiple parent trackers, choosing when to recycle tags, how many inflight tags)
- Upshot: event tracing structures can be synthesized via a hardware compiler pass
Tracking Out-Of-Order Trackers
- We can build a transition system for each event instance (tag)
- Track how each tag flows through the system until it is consumed by an event as a parent
- All this logic can be synthesized
- Implementing this structure manually would be tedious and error-prone
Additional Complexity
- When should a tag be retired? What if an event has multiple children?
- What if tags are referred to as parents of an event that produces that tag? Need to break loops
- e.g. replaying instructions in the Rocket pipeline when a structural hazard is present
- Can information flow tracking scale for an entire SoC?
- Everything propagates to everything. How can we limit the propagation scope of a tracker?
Conclusion
- Microarchitectural event tracing enables many cool things
- Graph analysis to identify performance bottlenecks, anomalies, unique traces
- Post-silicon event tracing and model correlation with real workloads + event pruning / compression / encoding
- Performance model extraction from RTL via unsupervised learning
- Construct high-level event traces from functional simulation
- Train a model to synthesize event graphs given partial traces